How we change what others think, feel, believe and do
|
|
How we change what others think, feel, believe and do |
The Price-Quality Graph and the Fair-Value Line
Disciplines > Marketing > Pricing > The Price-Quality Graph and the Fair-Value Line Quantifying quality | Building the Price-Quality graph | Drawing the Fair-Value line | Determining your pricing strategy | See also
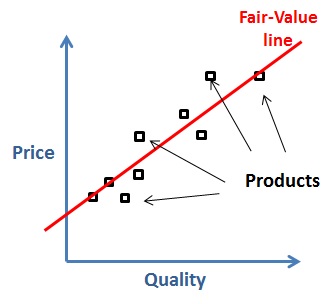
How do you understand a marketplace where there are many products, many features and many prices? The Price-Quality graph plots all competitors in a marketplace on a simple two-dimensional graph, which should allow a fair-value line to be identified. You can then use this to determine your pricing strategy. Quantifying qualityTo plot the 'quality' on a two-dimensional graph, it needs to be reduced to a single figure. While this can be tricky, a weighting table can be used as below.
To use this, first list the obvious features and also other attributes that will lead customers to want to buy the product (without considering price). Then assign each of these a 'weight', which is a score based on the desirability of each attribute. This should use a simple scale, for example one to five. In the example above, the chosen attributes are size, resolution and brand image, with weights 5, 4 and 3 respectively. Then score each product for each attribute. A similar 1-5 scale may be used. Where there are numeric variables such as 'size', still give a score based on desirability rather than use the variable value (such as inches) as this would bias the final calculation. A separate conversion table can be used to allocate score to variable ranges. Finally multiply each product-attribute score by the attribute weight and add each of these to give the product quantified quality total. For example in the table above, product B is given a score of 3 for 'size', which is multiplied by the size weight of 5 to give 15. Added to the resolution and brand image weighted scores this gives a total quantified quality figure of 43. Note that while this gives a quantitative answer, it is far from an exact science. You can make it more accurate by engaging customers in determining attributes, weights and scores, though even this will not give a perfect result. Building the Price-Quality graphTo build the Price-Quality graph, first list all products for comparison and build a quantified 'Quality' score for each, as described above. Then draw a graph using this number and the price of each product. Determining a realistic price can be tricky when discounts are common, so a consistent means of identifying this is needed.
Draw the Fair-Value lineAfter drawing the graph, an 'average' line may be drawn through the product points. This may be done mathematically, for example using the 'method of least squares' to identify a straight line. As this is not an exact science, an approximation by eye may also be sufficient. If the points shape a curve, then you may alternatively want to draw a curved line to fit. A typical time this will happen is when luxury goods are sold in a much higher price price bracket that reflects the exclusivity of the product or the extra work entailed in it. Curves are typical when the quality quantification table does not take account of intangible desirables such as this. A variation on curves is a set of straight lines with angles at market change points. It is also possible to have more than one line appearing. This is typical when products cross markets and each market values the items differently (and where prices may reflect this). In such cases, you may want to do a separate chart and pricing for each market. Determining your pricing strategyTo determine your pricing strategy, first start by assessing your products using exactly the same method for quantifying quality as above. Then decide what price you are going to choose based on where this will place your products on the graph. There are four general strategies you can use in this: Market-aligned pricingMarket-aligned pricing puts your product 'in the pack', close to other similar products. This is valid when you have a clear channel to market and where the ability of the sales people in closing deals is a significant factor. Good-value pricingThe best price is often just to the higher quality side of the line (below the line in the graph above), so the product looks like good value without causing confusion. This makes sense when customers choose products from a clear set of alternatives, such as in supermarkets. Great-value pricingIt can alternatively be a deliberate market-disruptive approach to go well beyond fair value, offering exceptional value as compared with current products. This can cause confusion and, if not managed well, can damage your brand as customers reframe it as 'cheap'. Sale prices may well be positioned here to shift excess stock. You may also place products here as a competitive tactic, for example to grab market share or attack new market entrants. Poor-value pricingSometimes putting the product point above the fair-value line can be effective and can lead to big profits, although there is a great danger here of customers being disappointed and so not buying from you again. High price is often equated to high quality and customers may buy your products under this assumption. This is a typical strategy for fly-by-night market traders who can persuade customers they may never see again that they are selling better quality than actually exists. Another use of poor-value pricing as a comparison. You can place products here that you do not expect to sell, but which are simply used to make the market-aligned products seem like good value. See also | |||||||||||||||||||||||||||
Site Menu |
|
| Home | Top | Quick Links | Settings | |
|
Main sections: | Disciplines | Techniques | Principles | Explanations | Theories | |
|
Other sections: | Blog! | Quotes | Guest articles | Analysis | Books | Help | |
|
More pages: | Contact | Caveat | About | Students | Webmasters | Awards | Guestbook | Feedback | Sitemap | Changes | |
|
Settings: | Computer layout | Mobile layout | Small font | Medium font | Large font | Translate | |
You can buy books here |
|
And the big |
|
| Home | Top | Menu | Quick Links | |
|
|
Site Menu |
|
| Home | Top | Quick Links | Settings | |
|
Main sections: | Disciplines | Techniques | Principles | Explanations | Theories | |
|
Other sections: | Blog! | Quotes | Guest articles | Analysis | Books | Help | |
|
More pages: | Contact | Caveat | About | Students | Webmasters | Awards | Guestbook | Feedback | Sitemap | Changes | |
|
Settings: | Computer layout | Mobile layout | Small font | Medium font | Large font | Translate | |
|
| Home | Top | Menu | Quick Links | |
|
|