How we change what others think, feel, believe and do
|
|
How we change what others think, feel, believe and do |
Regression-Discontinuity design
Explanations > Social Research > Design > Regression-Discontinuity design Description | Example | Discussion | See also
DescriptionThe regression-discontinuity design uses a cut-off selection method, for example where subjects are selected based on scoring above or below a certain value on a previous test. In design notation, this is:
The key aspect about this design is that the control group is made up of those who fall at the other side of the cut-off score. The sample is thus cut in two, with one group as control and the rest as the treatment group. ExampleA training module is designed to increase the visual-spatial ability of people with lower 'IQ'. A sample is selected and tested for IQ, with those scoring below 100 being allocated to the cut-off group. A test for visual-spatial ability was then administered before the lower-IQ group was given the training. A post-test score showed that their ability had increased in this area.
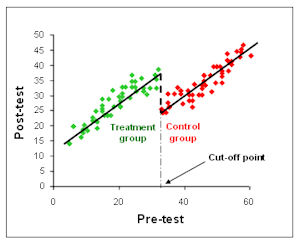
DiscussionThis is a relatively unusual design that is very useful in specific situations. In practice, if the cut-off selects only a small number, then the control group may also be constrained. In the same way, more subjects may be sought for the control group if the treatment group takes a significant majority. The name 'regression discontinuity' arises because the assignment by score causes a discontinuity across this score boundary between pre-test and post-test and between treatment and control groups, as in the diagram below.
See also
|
Site Menu |
|
| Home | Top | Quick Links | Settings | |
|
Main sections: | Disciplines | Techniques | Principles | Explanations | Theories | |
|
Other sections: | Blog! | Quotes | Guest articles | Analysis | Books | Help | |
|
More pages: | Contact | Caveat | About | Students | Webmasters | Awards | Guestbook | Feedback | Sitemap | Changes | |
|
Settings: | Computer layout | Mobile layout | Small font | Medium font | Large font | Translate | |
You can buy books here |
|
And the big |
|
| Home | Top | Menu | Quick Links | |
|
|
Site Menu |
|
| Home | Top | Quick Links | Settings | |
|
Main sections: | Disciplines | Techniques | Principles | Explanations | Theories | |
|
Other sections: | Blog! | Quotes | Guest articles | Analysis | Books | Help | |
|
More pages: | Contact | Caveat | About | Students | Webmasters | Awards | Guestbook | Feedback | Sitemap | Changes | |
|
Settings: | Computer layout | Mobile layout | Small font | Medium font | Large font | Translate | |
|
| Home | Top | Menu | Quick Links | |
|
|